About ZAP

The mission of the Zoo, Arts & Parks (ZAP) program is to enhance Salt Lake County resident and visitor experiences through art, cultural, historical, and recreational offerings. The program fulfills its purpose by:

Grantmaking: Providing fair and equitable access to ZAP funding and education resources by making grants to qualified nonprofit organizations in the categories of Tier I, Tier II & Zoological.

Promotion: Increasing public awareness of the value of ZAP.

Capacity Building: Providing adequate predictable support for organizations within the Zoological and Tier I categories and providing enhanced support for the organizations within the Tier II category.

How does ZAP work?

The Salt Lake County Zoo, Arts & Parks (ZAP) program was first voted on and passed by Salt Lake County residents in 1996, awarding its first grants in 1997. Every 10 years, the ZAP program is placed on the ballot for County residents to vote for the program's renewal.

For each purchase in Salt Lake County that includes sales tax, one (1) penny of every $10 spent goes to ZAP, and all those pennies add up! ZAP provides grants to over 230 nonprofit organizations in the community, supporting a wide array of programming including events, classes, festivals, museums, and more. Funding also supports Salt Lake County Parks & Recreation including recreation centers, parks, and open spaces.

ZAP offers three categories of grant funding to art and cultural organizations: Tier I, Tier II, and Zoological. Each application is reviewed by the corresponding ZAP Tier I (and Zoological) and Tier II Advisory Board. The Advisory Board's funding recommendations are presented to Salt Lake County Council for approval.

Funding History

Click the total awarded numbers to see a list of all grantees for that year.

Year Tier I Tier II Zoological
2023 $16,591,177.96 $3,412,184 $5,899,085.49
2022 $16,477,830.18 $2,645,932 $5,858,789.13
2021 $14,678,811.66 $2,455,850 $5,219,133.98
2020 $12,282,994.54 $2,347,400 $4,367,288.56
2019 $11,829,467.54 $2,381,825 $4,206,036.45
2018 $11,311,626.08 $2,207,800 $4,021,914.47
2017 $10,556,120.44 $1,982,900 $3,753,289.00
2016 $10,739,078.01 $1,910,450 $2,664,170.05
2015 $10,284,064.87 $1,804,150 $2,551,289.72
2014 $9,745,598.23 $1,752,000 $2,417,705.90
2013 $9,298,498.98 $1,718,652.32 $2,306,788.67
2012 $9,057,097.00 $1,672,063.23 $2,246,901.19
2011 $8,140,308.00 $1,549,688.29 $2,019,462.00
2010 $7,869,574.52 $1,466,479.85 $1,952,298.53
2009 $7,863,553.64 $1,439,000.00 $1,950,804.86
2008 $8,841,068.60 $1,633,902.87 $2,193,308.58
2007 $10,385,885.42 $2,002,182.81 $2,576,549.59
2006 $9,678,746.36 $1,782,275.54 $2,401,121.21
2005 $9,174,244.18 $873.737.54 $2,184,343.85
2004 $8,437,200.83 $819,500.00 $2,008,827.34
2003 $7,952,920.25 $761,050.00 $1,868,336.61
2002 $8,021,906.73 $759,292.00 $1,909,976.65
2001 $8,112,670.63 $918,548.00 $1,931,588.25
2000 $8,118,477.56 $777,677.00 $1,932,970.85
1999 $7,678,407.30 $701,888.50 $1,828,140.06
1998 $7,443,655.46 $643,742.00 $1,772,298.92
1997 $6,679,658.53 $571,792.71 $1,590,396.03
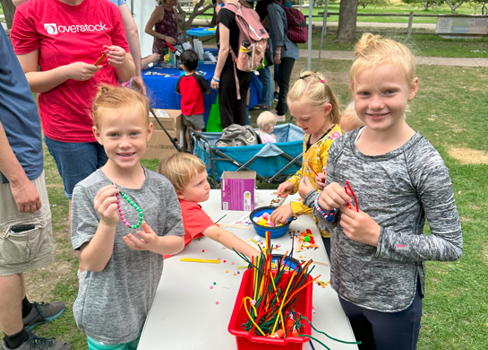
A group of children at a picnic.

ZAP Parks & Recreation

30% of the annual ZAP tax revenues support Salt Lake County Parks and Recreation operations.

Learn More About